
2025-06-18
In the high-pressure world of forex proprietary trading, performance is not just measured by profits. It's measured by consistency, risk behavior, and psychological resilience. One of the most honest reflections of these traits is your equity curve.
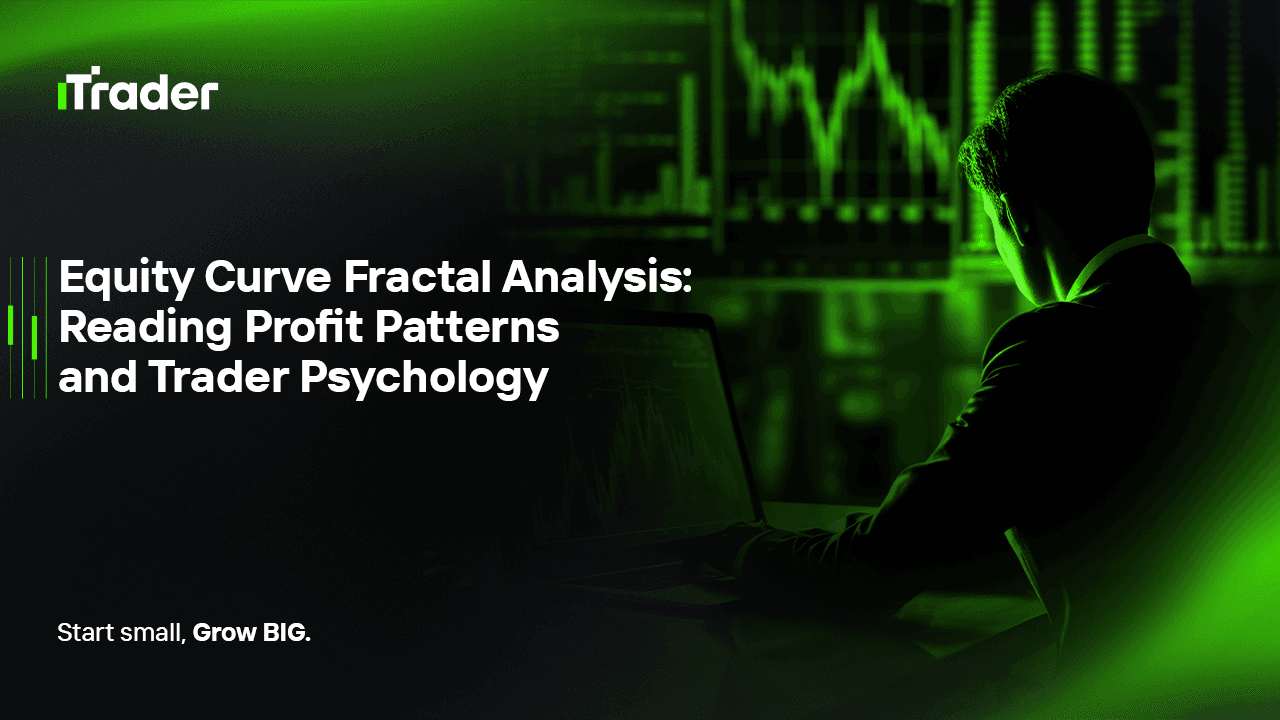
At first glance, your equity curve may seem like a simple line showing your balance over time. But beneath the surface, it tells a deeper story—a fractal story. It holds the repetitive cycles of your decisions, your emotions, and the way you deal with success and failure.
This post dives into a unique method of analyzing your equity curve using fractal thinking. You'll discover:
Every trade you place becomes a data point in your equity curve. But when viewed over weeks or months, this curve becomes more than a performance metric—it becomes a map of your behavioral tendencies.
For prop traders, equity curves are closely scrutinized:
The key is to read this curve like a diary. Each rise or fall represents a chapter—what you did, how you felt, and why it turned out the way it did.
Fractals are recurring patterns that appear across different timeframes. In trading, this means the same behavioral loops might repeat weekly, monthly, or even trade-by-trade.
Common fractal patterns in equity curves include:
This repetition is rarely random. It stems from internal cycles—your reaction to risk, your response to gains, and your emotional thresholds.
Recognizing these fractal patterns allows you to anticipate your own self-sabotaging behaviors before they repeat again.
You can break down any equity curve into several psychological and tactical zones:
Growth Phase
This is where confidence is high, trades are aligned with the system, and execution is clean. However, it can easily lead to overconfidence. Traders must monitor for excessive risk-taking after streaks of gains.
Plateau Phase
This period of low or sideways growth is often misunderstood. It can signal indecision, fear of loss, or strategy fatigue. Many traders begin system-hopping or lose motivation here, despite being in a statistically normal performance lull.
Drawdown Phase
Here, emotions take center stage—fear, frustration, and revenge trading tendencies often surface. The key to navigating this phase is psychological preparation and clear rules for loss limits and recovery behavior.
Recovery Phase
A return from a drawdown reveals the trader's discipline. Recovery without strategy modification often indicates faith in one's edge. However, “forced recovery” trades—aggressive attempts to regain losses—usually extend the damage.
These zones appear across all timeframes, which is why analyzing your equity curve fractally is so powerful. You might see the same sequence unfold in a single week as you do over several months.
This doesn’t require complex math. Instead, look for recurring shapes, angles, and emotional triggers in your curve.
Step-by-step approach:
By treating your equity curve like a psychological fingerprint, you begin to see not just how your system performs, but how you behave under different conditions.
In the context of prop firm trading, where drawdown limits are strict and consistency is prized above all, equity curve analysis becomes a survival tool.
Here’s what it offers:
Your equity curve reflects your risk tolerance, your biases, and your stress thresholds.
Some examples of psychological traits visible in equity curves:
More importantly, the repetition of these traits is what fractal analysis uncovers. You don’t just see a trader’s behavior—you see how that behavior repeats across time and stress.
At its core, fractal equity analysis is not about predicting market moves. It's about understanding yourself through the patterns you unconsciously repeat.
In prop trading, where capital is external, drawdowns are monitored closely, and traders are constantly evaluated, the ability to read your equity curve fractally can be the difference between getting funded and getting cut.
So ask yourself:
The most successful prop traders are not just masters of strategy. They are masters of self-diagnosis, and the equity curve is their ECG.
2025 Ай Трейдер Глобал ХХК | Компанийн бүртгэлийн дугаар: 15962
Ай Трейдер Глобал ХХК нь Комор улсын Анжуан арал дахь Мутсамуду хотын Хамчакод байрлалтай. Тус компани нь Коморын Үнэт Цаасны Хорооноос (Securities Commission of the Comoros) олгосон L15962/ITGL дугаартай тусгай зөвшөөрлийн хүрээнд үйл ажиллагаа явуулдаг.
Ай Трейдер Глобал ХХК нь “iTrader” нэрийн дор үйл ажиллагаа явуулдаг бөгөөд (Форекс) арилжааны үйл ажиллагаа явуулах эрхтэй. Компанийн лого, барааны тэмдэг, вэбсайт нь зөвхөн Ай Трейдер Глобал ХХК компанийн өмч юм.
Ай Трейдер Глобал ХХК -ийн охин компани болох : iTrader Global Pty Ltd, Австралийн компанийн бүртгэлийн дугаар (ACN): 686 857 198. Энэ компани нь Opheleo Holdings Pty Ltd компанийн албан ёсны төлөөлөгч бөгөөд Австралийн санхүүгийн үйлчилгээний төлөөлөгчийн дугаар: 001315037 -тай. Австралийн санхүүгийн үйлчилгээний лицензийн дугаар: 000224485 -тай Level 1, 256 Rundle St, Adelaide, SA 5000 хаягт байршдаг. Анхааруулга: Энэ байгууллага нь энэхүү вэбсайт дээр болон дамжуулан арилжаалагдаж буй санхүүгийн (арилжааны) хэрэгсэл нийлүүлэгч биш бөгөөд ямар нэгэн хариуцлага хүлээхгүй болно.
Эрсдэлийн сэрэмжлүүлэг: CFD арилжааны хөшүүргийн улмаас хөрөнгөө хурдан алдах өндөр эрсдэлтэй тул бүх хэрэглэгчдэд тохиромжгүй байдаг.
Фанд, CFD болон бусад өндөр xөшүүрэгтэй арилжаа нь хэрэглэгчээс нарийн төвөгтэй ойлголтуудын талаар тусгай мэдлэг шаарддаг. Хөшүүрэгтэй арилжаанд оролцогчдын 84.01% нь алдагдал хүлээдгийг судалгаанууд харуулдаг тул хөшүүрэгтэй арилжаанд орохоос өмнө хөрөнгөө алдах маш өндөр эрсдэлтэй болохыг анхаарна уу.
iTrader нь аливаа иргэн, хуулийн этгээдийн өмнө xөшүүрэгтэй арилжааны эрсдэл, алдагдал, бусад хохирлыг бүхэлд нь хариуцахгүй болохыг мэдэгдэж байна.
Энэхүү веб сайтын мэдээ, мэдээлэл нь зөвхөн мэдлэг түгээх зорилготой тул хэрэглэгч та бие даан шийдвэр гаргана уу.
Хязгаарлалт: iTrader нь вэбсайт болон үйлчилгээгээ тухайн орны хууль тогтоомж, дүрэм журмаар хориглосон орнуудад оршин суугчдад чиглүүлдэггүй. Хэрэв та энэхүү вэбсайтыг ашиглахыг хориглосон оронд байгаа бол вэбсайт болон үйлчилгээг ашиглахдаа тухайн орны хууль тогтоомжид нийцэж байгаа эсэхийг шалгах үүрэгтэй. iTrader нь вэбсайтынхаа мэдээлэл бүх оронд тохиромжтой эсэхийг баталгаажуулдаггүй.
Ай Трейдер Глобал ХХК нь зарим улс орны иргэдэд үйлчилгээ үзүүлэхээс татгалздаг болно. Жишээлбэл: АНУ, Орос, Бразил, Канада, Израйл, Иран.